
Sample files
Download sample files here:
Sample
test file: sample_dummy_files.zip
- sample file with no real biological data; set whichever thresholds you please.
Progression dynamics of cell division defects: dataset.mitocheck.zip
- The data in this file contains values for every gene that indicate the impact of each knockdown on a phenotype;
to
obtain the landscape of transitions from one phenotype to the other, set the threshold for each phenotype to be greater than "-1".
Note: you need to be patient to obtain the heat map view, because computing the clustered heat maps is time consuming
for
such
a
big dataset (allow 2-3 minutes).
Cancer pathway connections: dataset.cancerPathwayConnections.zip
- The gene-associated values in the input file are binary: 0 indicates no peak at the corresponding time point for a
gene enriched in the pathway; 1 indicates a periodic peak. To visualize the connections between pathways at periodic transcriptional peaks, set the threshold for each
phenotype to be greater than 0.
Linking drug abuse phenotypes: dataset.commonDrugMechanisms.zip
- The gene-associated values are transcriptional levels as induced by drug intake. The thresholds that must be set to
visualize similar drug effects on genes are described in the paper (i.e. the lower and upper quartiles, calculated for the set of genes for every drug
phenotype).
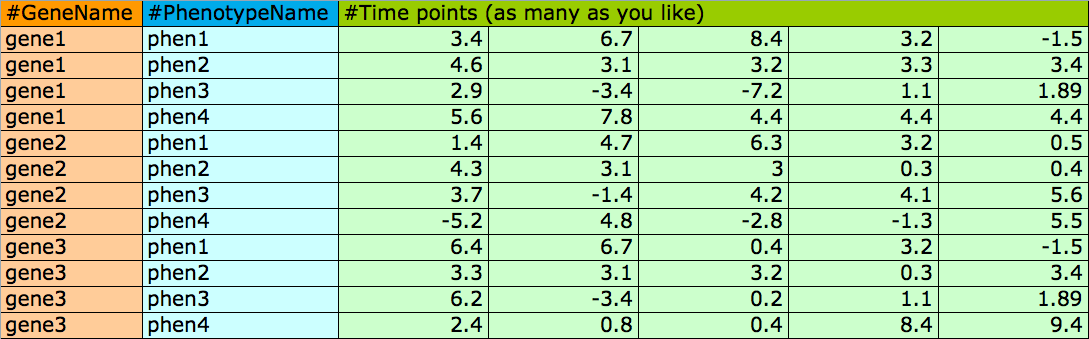
File format for main input file of time-resolved phenotypic data (fields are separated by whitespace):
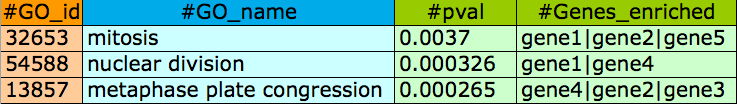
File format for GO network enrichment(fields are separated by tab):
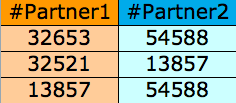
File format for GO network interactions or any other network (PPI, metabolic, etc.) inputted by the user(fields are separated by tab):
The file format for the bar chart is one value per line, with a total of n lines where n is the total number of time points.