
Bar chart
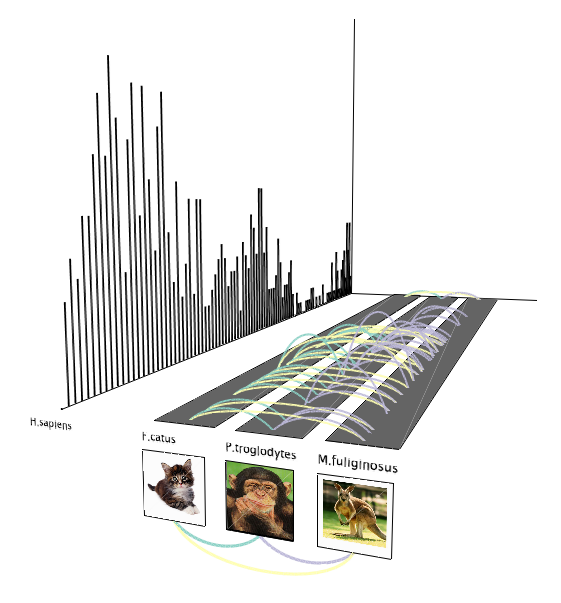
The user can load a separate file of time course single vector values and visualize it in PhenoTimer along with the phenotypic data. Thus, a bar chart will be displayed in parallel to the arc connections. This bar chart can be interpreted as any associated time point values, if it serves to better understand a particular biological question. The bar chart display is only available for 3D arc mode.