Statistics
For the 3D and 2D arc modes, we reorder the phenotypic lanes for optimal viewing of connections in order to minimize clutter and link overlap. To this purpose, we use an agglomerative hierarchical clustering algorithm to maximize the number of links between two adjacent phenotypes.
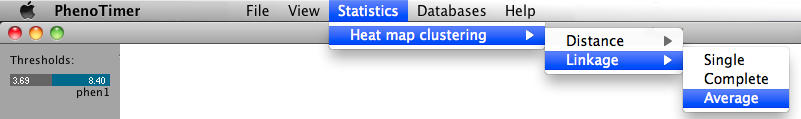
The heat maps of gene-associated values for each phenotype are generated and displayed separately for each time point. The rows and columns are clustered using agglomerative hierarchical clustering. The user can choose between single, average or complete linkage and Euclidean or Manhattan distance.